Data Made Better: How data pipeline automation transforms the Quality of Life Explorer
The UNC Charlotte Urban Institute and its partners at the City of Charlotte and Mecklenburg County celebrate the 10th Anniversary of the Quality of Life Explorer during 2023-2024.
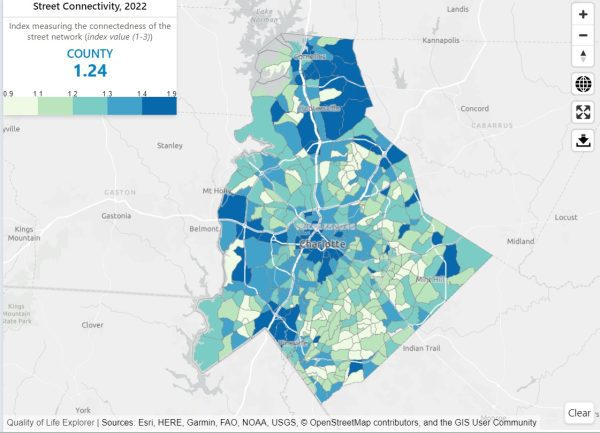
How can we understand Charlotte’s urban growth more holistically? With the Charlotte-Mecklenburg Quality of Life Explorer, of course.
With it, we can also identify the spatial and temporal relationships that exist – and matter – between its indicators. We can explore the ways in which we model and monitor changes to inequities and disparities of outcomes over time, as well as keep up with the factors that contribute to them. This powerful data tool also invites us to explore the ways in which we can integrate Explorer variables with the data assets of the Charlotte Regional Data Trust, and other sources, to garner insights on our changing communities.
Beyond its usefulness and enduring impact on our community, the 10–year anniversary of the Quality of Life Explorer (Explorer) coincides with another key milestone in the project’s evolution and its transformative potential.
[Read The Quality of Life Explorer: Ten Years and Counting]
In March 2023, we completed version 1.0 of the Charlotte-Mecklenburg Quality of Life Explorer automation project. We automated most of the data and computational processes needed to generate more than 80 quality of life indicators featured in the Explorer and created functional data pipelines to serve the application. Through this work, we significantly streamlined, and fundamentally transformed, the nature of our engagement in the Explorer. The completion of this work also revitalized our team’s vision to build a reproducible data science framework at the Urban Institute and a unified data ecosystem.
Below, I discuss the changes we made and offer thoughts on reimagining how the Explorer and its rich data could be made more powerful and useful in understanding the Charlotte-Mecklenburg community.
Where We Started
The automation project informally started in fall 2021 with the primary goal to update data delayed by the pandemic and staff transitions. Much had to be done, and quickly; there were dozens of variables spanning multiple years to update.
We completed the backlog by early spring 2022. More importantly, our work during this time helped us better understand how our processes could be more efficient and how reproducible analytical processes could transform the maintenance of the Explorer.
Set the Foundation
Much of the early work focused on developing Python scripts (thanks to Providence Adu) that could replace manual geoprocessing and aggregation operations to compute the indicators for each NPA. These scripts set the foundation for coding in the project, but they were not ready to align with a persistent data pipeline because several key processes remained manual.
During this period, we also wrote scripts to review the computed indicators and convert them to an appropriate format to serve the Explorer’s web portal which is maintained by the City.
Finally, we designed and developed a SQL server database (thanks, Pratik Chaudari) that replaced our dinosaur Microsoft Access database. By spring 2022, we could ingest the computed Quality of Life Explorer indicators with the Charlotte Regional Data Trust’s integrated data system expanding the capacity of both tools.
This work created important building blocks to formalize the automation project and the structuring of data pipelines.
Refine and Reshape
Our next step was to reorganize and optimize the Python scripts and create common categories of workflows based on shared data assets and/or computational processes.
For example, indicators developed using the census API (Application Programming Interface) had a set of common routines and proximity indicators (i.e, proximity to grocery stores, health care, etc.). They also had similar processes for data preparation and calculation. In addition, there were lateral processes, such as geocoding, that affected more than one category of workflows. During this time, development of compute functions and scripts continued, and more indicators were added to the automation framework.
Move to the Cloud
Until the start of fall 2022, the automation project relied mainly on the exceptional work done by Urban Institute graduate research assistants. Bringing our new data scientist, Nick Occhipinti on board increased our capacity to align the work of the Explorer automation project with the larger vision of a unified data analytic ecosystem. A graduate of UNC Charlotte’s School of Data Science, Nick began to build critical components for the reproducibility framework at the Institute, including a test instance of an Amazon Web Services (AWS) relational database service that could house the Institute’s data assets including the ones consumed by the Explorer project.
As work progressed, we tackled the residual manual work that still lurked in the post-processing parts of the project. We developed scripts to automate the ETL components after the indicators were computed. We also reconfigured the review process and enabled a streamlined ingestion into the AWS database that now houses the Explorer data. This critical work brought an end to this phase of the project.
The QOL Explorer as a Powerful Research Engine
So, why would we go through all this trouble? Why would we invest considerable time to streamline, update, and automate the backend processes of the Explorer? The Quality of Life Explorer interface already offers so much insight into our communities, helping us map where we see similarities and often problematic differences across over 80 variables.
Completing the data pipeline automation project offers exciting pathways to reimagine the Quality of Life Explorer; to ask new questions, and dig deeper into Charlotte-Mecklenburg’s story. More specifically, our focus can finally shift from maintaining labor-intensive manual data processes to developing research and analysis of the Explorer’s rich and unique data.
The possibilities of the Quality of Life Explorer are exciting. More importantly, they enable us to further transform the Explorer from a data tool to a robust and comprehensive research and storytelling engine that directly informs policies, programs, and people in our region. Ultimately, the Explorer enables us to accomplish our purpose – to equip change agents with the information and tools they need to drive equitable and sustainable outcomes for our Charlotte region.