Explore local housing data with new interactive maps

We often paint Charlotte’s housing market in broad strokes: rising prices, bidding wars and gentrification reshaping neighborhoods.
Updated data on the Charlotte/Mecklenburg Quality of Life Explorer lets you can dig deeper into the story told by those aggregate numbers. Charlotte’s neighborhoods are starkly different when it comes to characteristics such as what percentage of homes are rentals, where publicly subsidized affordable housing is located and the size of the average single-family house.
Many of those variables are correlated with other characteristics, such as the race of residents, health, average income and even average age of death. You can explore these and dozens of other data points, seeing how they interact and overlay, as well as seeing how the data has changed over time.
The Quality of Life Explorer is a partnership between the city of Charlotte, Mecklenburg County and the UNC Charlotte Urban Institute. The maps are free, searchable, customizable and fully embeddable on other websites. The underlying data is also available to download.
[Check out the Quality of Life Explorer]
Here are some of the updated housing maps now available:
Rental houses
Countywide, just over 22% of single-family, detached homes are rental houses. That’s up from 20.5% in 2015, an increase that comes as national single-family rental companies buy up more homes in the region. The share of rental housing varies widely across the county, from around 3% in parts of southeast Charlotte to 70% or more in lower-income neighborhoods north, west and east of uptown.
Home sales price
Across Mecklenburg, homes sold for an average of $365,860 last year. That’s up from $267,916 in 2013, according to Mecklenburg County Register of Deeds sales data.
Houses in two parts of the county average well over $1 million: southeast Charlotte, including the SouthPark area and Quail Hollow, and northwest Mecklenburg County along the lake. In lower-income neighborhoods — those traditionally defined as Charlotte’s “crescent” — sales still average below $200,000, likely driven lower by the prevalence of homes being sold as tear-downs for demolition and replacement.
Single-family housing prevalence
Much of our local housing discussion centers around single-family homes, especially in light of Charlotte’s controversial plans to eliminate single-family-only zoning throughout the city. But that misses the fact that almost half of the housing in Mecklenburg — 44.1% — is already made up of apartments.
Across the county, the prevalence of single-family houses as a percentage of total housing in different tracts varies from almost none to almost all.
Development-based housing subsidies
Despite efforts to break up concentrations of poverty, subsidized housing units for lower-income residents aren’t distributed equally across our community. There are 12,386 housing units with development-based rental assistance in Mecklenburg County, up from just over 10,000 in 2013. That includes properties funded with low-income tax credits, public housing developments by Inlivian (formerly the Charlotte Housing Authority), developments by DreamKey Partners (formerly the Charlotte Mecklenburg Housing Partnership), developments with funding from the Charlotte Housing Trust Fund and more.
Housing size
Price, rental status and percentage of single-family homes aren’t the only major way houses differ across different neighborhoods in Mecklenburg County. The average size of single-family homes also varies significantly: In parts of wealthier southeast Charlotte and northern Mecklenburg, homes average over 4,000 square feet of heated living space. In much of the “crescent,” dominated by older, smaller houses, homes average just over 1,000 square feet.
And our houses are getting bigger, as the average size has grown almost 10% in the past decade, to 2,230 square feet.
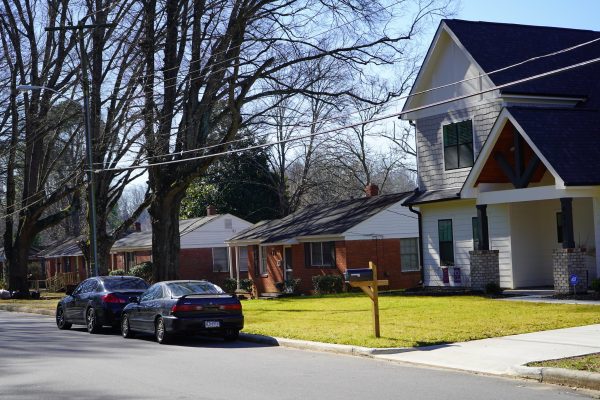
Changes in this metric reflect deeper dynamics in many neighborhoods. Take the tract that includes Villa Heights, for example. In 2011, the average home size was 1,047 square feet. After a decade of gentrification and redevelopment, with many existing houses replaced by new, larger buildings, the average house there is now almost 1,600 square feet — a common trend in many parts of the city.
Housing code violations
Many parts of the city see a negligible number of housing code violation reports. But there’s a clear pattern in the areas that do: the crescent of lower-income neighborhoods west, north and east of uptown. In those areas, housing code violation reports vary from an average of 1-2 per 100 housing units to as high as 8 per 100 housing units.